Platform Engineering: Metrics and Alerting as Service
Chapters
The status page was completely green, yet a subtle edge-case failure emerged in a test environment. Your dashboards weren’t lying; they just answered questions no one had thought to ask yet.
Because logs lacked efficient querying and distributed traces were aggressively tail-sampled to control costs, the single execution path that mattered was discarded. You were drowning in data but starving for a signal.
Does that scenario ring a bell?
Teams typically react by demanding “more observability,” leading developers to over-instrument every method. This bloats dashboards and forces frequent runbook rewrites, ultimately making the entire system increasingly difficult to comprehend.
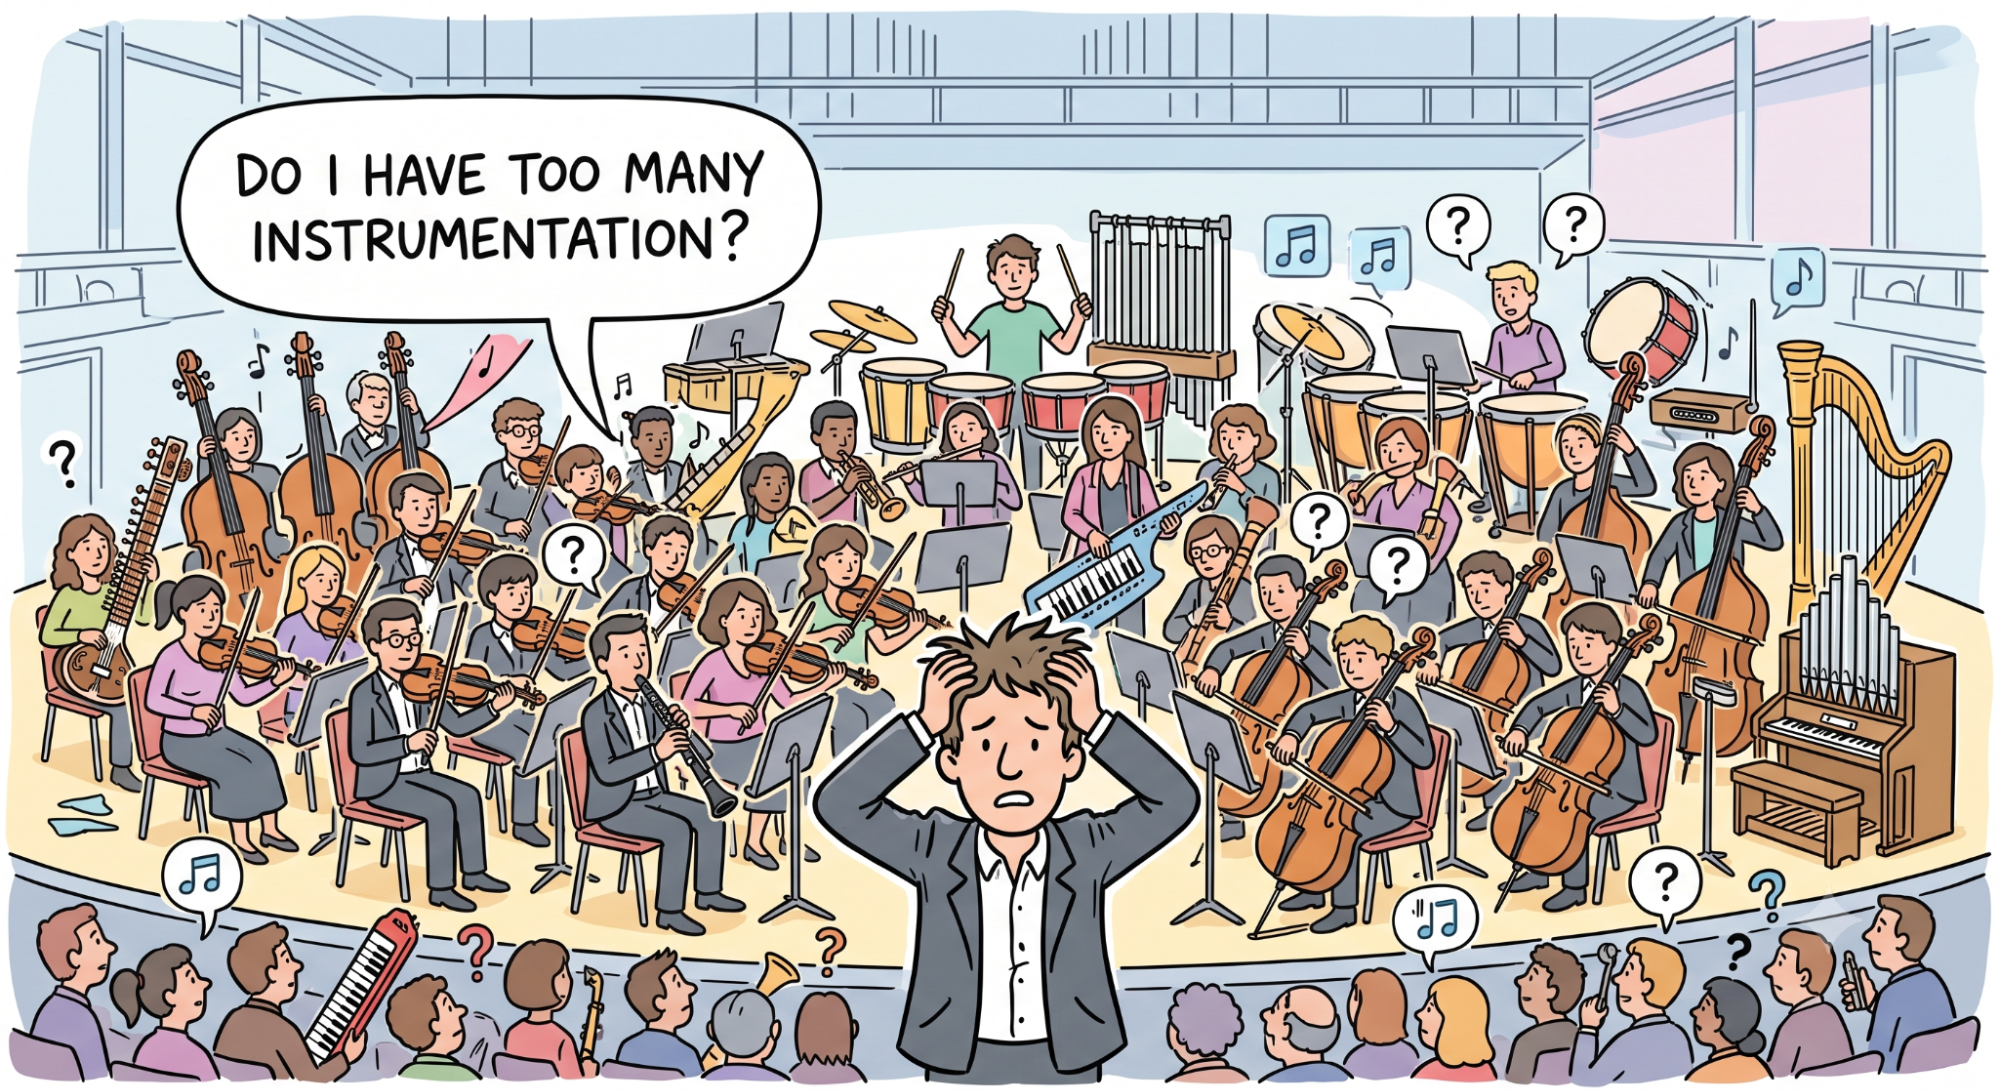
With accelerating development velocity and diverse features, metrics must form a cohesive platform rather than an ad-hoc collection. Metrics are efficient to query, cost-effective to aggregate, and provide a comprehensive system-wide view under heavy load. While logs and traces serve as investigative tools once a problem area is isolated, metrics act as the initial compass directing your investigation.
This post explains why platform engineering teams focus on standardized approaches to counters, gauges, and histograms over localized fixes. We will dive into patterns for instrumentation and demonstrate how a single Prometheus histogram can address most operational challenges.
Why Platform Teams Can’t Afford Entropy
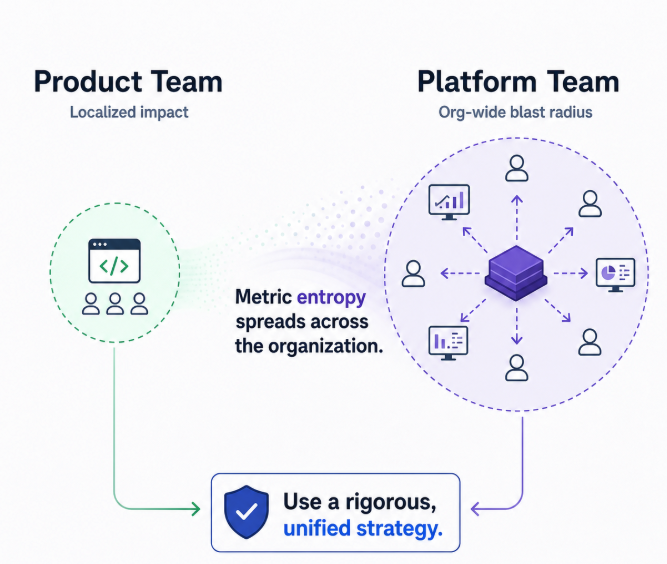
Unlike product teams, where mismanaged metrics have a localized blast radius, platform teams have no margin for error. When core services degrade, dependent downstream engineers must diagnose issues using your dashboards under acute pressure without critical context. Metric entropy in platform engineering impacts the entire organization, necessitating a rigorous, unified strategy.
How to Not “MELT”? Instrumentation Priorities
Metrics, Events, Logs, Traces (MELT) get pitched as four equal pillars. In an active incident they are not equal — there’s a strict order, and it maps directly to the cheap-to-expensive, broad-to-narrow logic above:
- Metrics first — bound the blast radius. What’s broken, how badly, since when.
- Logs second — once you know where, pull the exact exception or timeout.
- Traces (optional) — once you know what, find where the time is going.
- Events, in parallel — correlate the timing against a deploy or config push.
Metrics narrow the search space while logs give us the insights we need to cover exact cases.
The Prometheus Toolkit: Counters, Gauges, and Histograms
Before establishing a canonical observability pattern, we have to align on the underlying data structures. The monitoring ecosystem provides three foundational primitives, but using them interchangeably or inconsistently is the root cause of most dashboard drift and alerting fatigue.
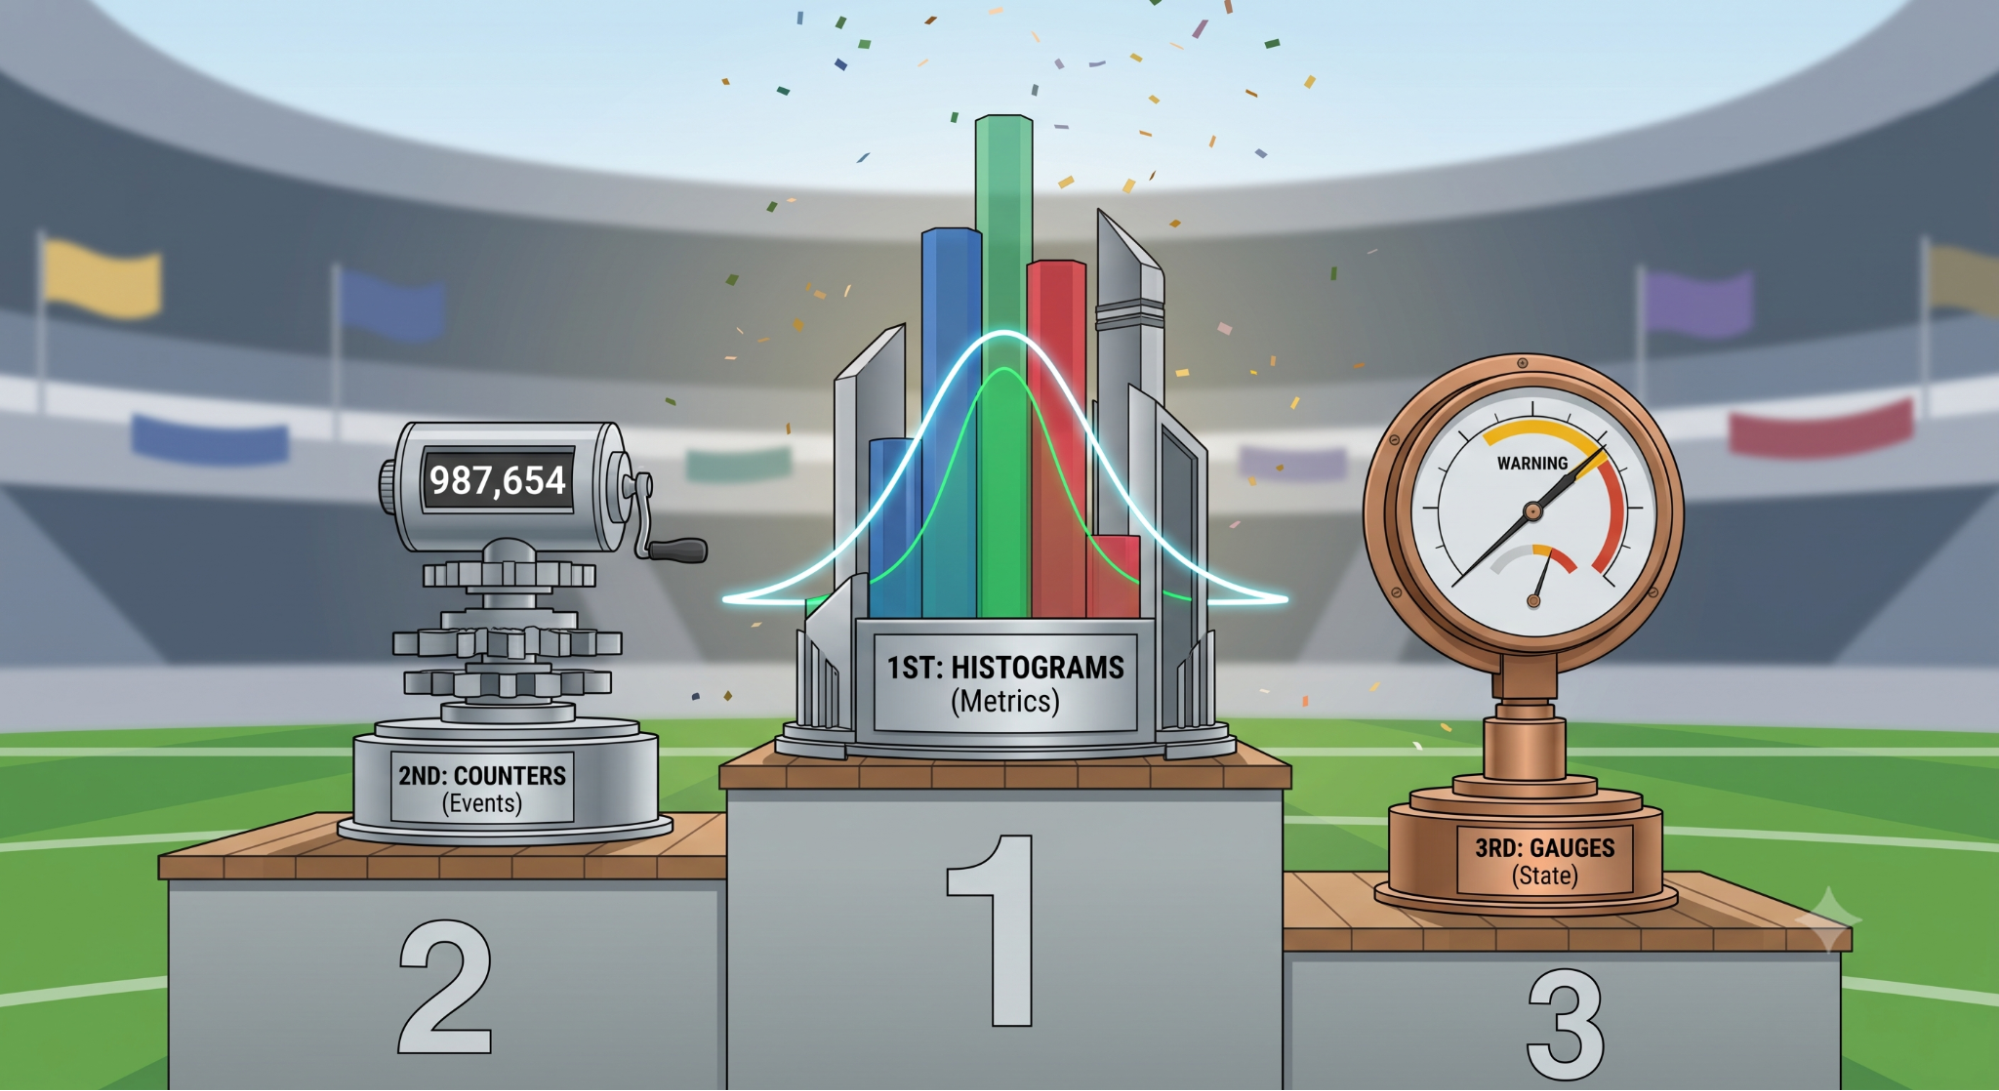
Counters are for discrete events tied to application logic: a request completed, a token was minted, a specific validation failed. Prometheus’s own instrumentation guidance is blunt about this — every meaningful log line or failure branch should have a counter behind it, because that’s how you turn “I found something interesting in the logs” into “here’s how often that’s been happening and since when.” Counters are the right tool for anything that happens once per event, scoped to your actual application logic and end-user-facing outcomes, not to infrastructure state.
Gauges are for things that go up and down — current queue depth, in-flight requests, connection pool utilization, replica lag. This is the category the RED-only framing quietly drops, and it’s exactly where saturation lives. A queue that’s steadily growing is a leading indicator of a latency spike that hasn’t hit your histogram yet — by the time P99 moves, you’re already late. Gauges are how you see the problem coming instead of just diagnosing it after it’s already reflected in caller-facing latency.
Histograms are for distributions — specifically, the RED trio for a given operation, captured as one atomic observation instead of three metrics that can drift apart. This is the piece that solves the “counter for requests, counter for errors, gauge for duration” anti-pattern: three independent updates that a pull-based scraper can catch mid-flight and misalign. One histogram observation per request removes that failure mode entirely.
The Canonical Histogram: One Metric, Zero Drift
Implementing core signals effectively across a complex platform requires disciplined instrumentation. Within the histogram piece specifically, the anti-pattern is a counter for total requests, a separate counter for failures, and a gauge or summary for duration — three things that are supposed to agree but structurally can’t. Prometheus scrapes are pull-based: if your traffic counter increments a beat before your duration timer does, you’ve got a scrape window where they disagree. This “atomic package problem” causes metrics to lose their internal consistency. Add slightly different label sets across the two counters, and you can’t even join them in a query.
The fix we can offer as a platform is to have one histogram per domain operation and system boundary, serving several functions including SLO, SLI, a wider set of performance metrics, showcasing how the system works under normal conditions, and tracking errors.
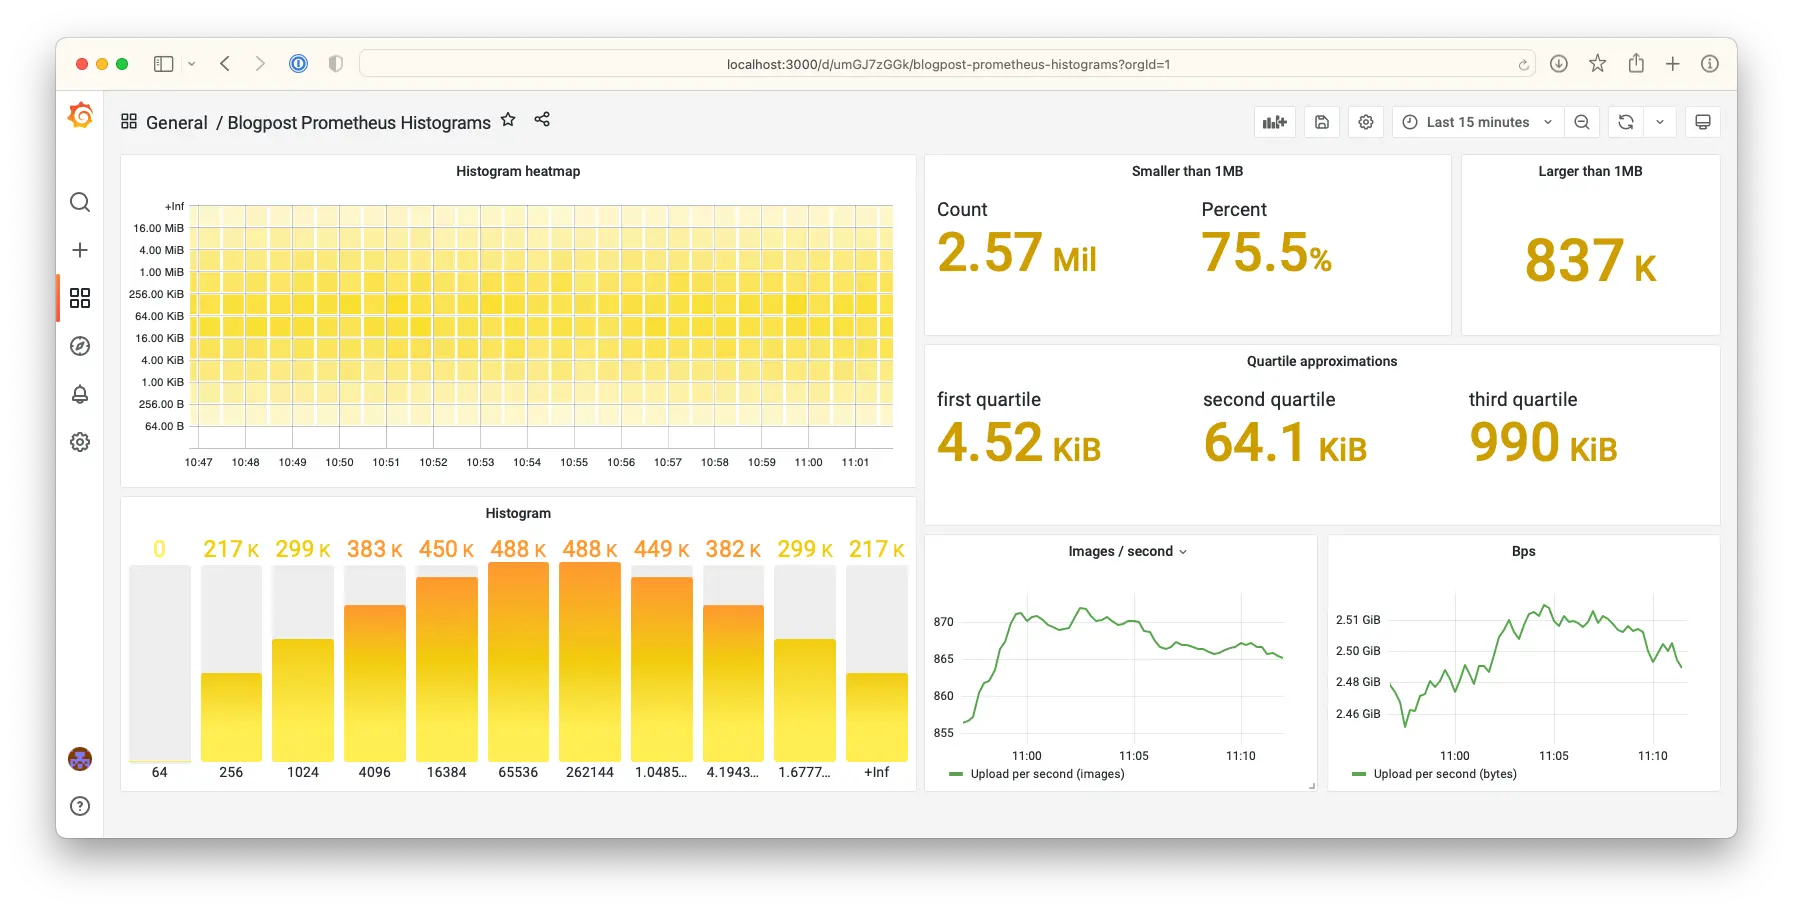
Here’s what that actually looks like in practice. Take platform_operation_duration_seconds — a single histogram carrying traffic, errors, and duration in buckets — and give it these labels:
operation— optional label to uniformly reflect what operation happened.outcome— whether the operation succeeded or failed, and with what specific error class (success,client_error,internal_error,timeout).behaviourMatch— a boolean flag indicating whether the new code path’s result matched the reference (legacy) path’s result for the same request. This is what turns the histogram into the backbone of a shadow-mode rollout: both paths execute, only the legacy response goes to the user, andbehaviourMatchtells you — before anyone’s exposed to it — whether the new path is actually producing equivalent outcomes, not just similar latency.
Both labels ride on the same observation. There’s no second metric to fall out of sync, no join required to correlate “did it fail” with “did it behave correctly” — one histogram, one write, three signals plus a rollout gate.
A classic Prometheus histogram gives you three time series for free from that single observation: cumulative _bucket counters (le="0.1" means “count of everything ≤100ms”), a _sum of observed values, and a _count of observations. All three are monotonic, which is what lets rate() aggregate cleanly across thousands of ephemeral pods without you thinking about counter resets.
Cardinality Is the Rule That Applies to All Three
Every unique label combination is a new time series in memory, regardless of metric type. Put a user ID, trace ID, IP, or raw URL path in a label and you’ve turned any counter, gauge, or histogram into cardinality hell. This is the fastest way to take down your own monitoring stack from the inside.
Prometheus’s own guidance suggests keeping cardinality per metric bounded and treating anything unbounded as an exception, not the default. For the histogram specifically, the bounded set that scales across every team you onboard: operation (what happened), outcome (error class). For gauges tracking saturation, keep labels similarly bounded — pool name or queue name, not per-request identifiers. Bucket boundaries matter for histograms too, but less than people think — get them roughly right for your latency profile and move on; Prometheus’s native histograms mostly remove the need to guess.
SLOs Built on Top, Not Bolted On
Picking alert thresholds by gut feel — “page if latency > 500ms” — trains your org to ignore pages. The fix: run the operation in preview/shadow mode for a couple weeks, let the histogram capture the actual baseline, and set the SLO off that data. If the preview shows 99.95%, commit to 99.9% and you’ve got real room to breathe.
At 99.9% over 30 days, you’ve got roughly 43 minutes of error budget for the month. What matters operationally is burn rate — how fast you’re spending it. This is where standardized histograms can be automatically converted into Sloth SLO dashboards.
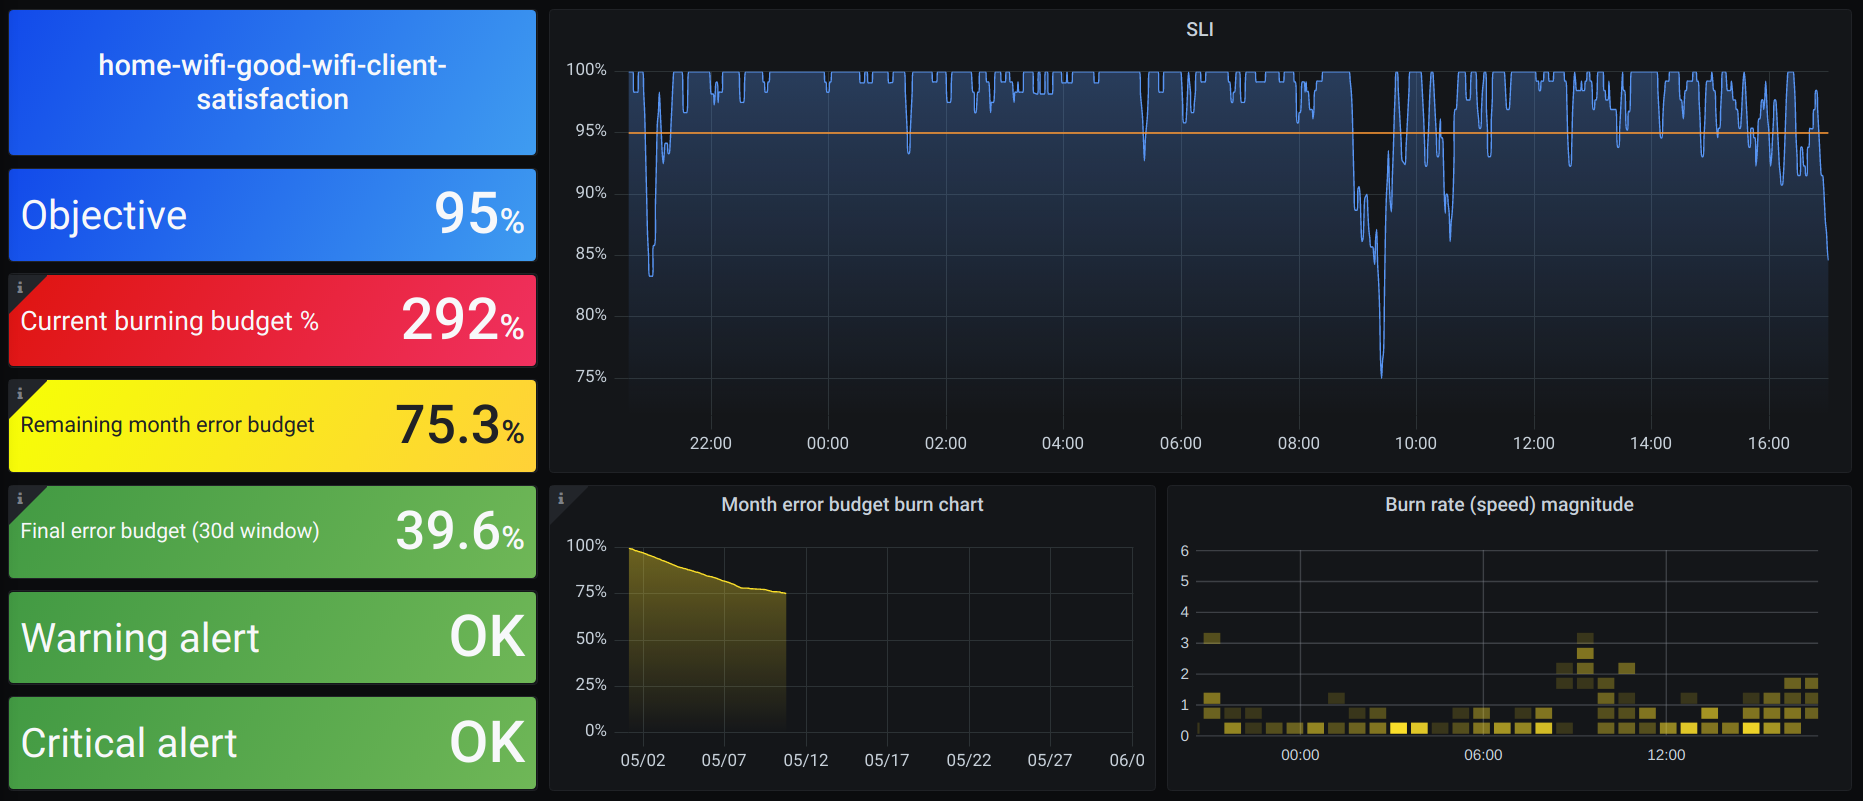
A 1-hour window at 14.4x burn rate exhausts the month’s budget in about 50 hours — that’s a page. A 3-day window at 1.5–3x burn rate leaks slowly enough to not page anyone but will blow the monthly number if ignored — that’s a ticket, not a 3am wakeup.
This works cleanly because success and failure counts come from the same histogram via the outcome label — you’re never reconciling two different data sources to compute a burn rate. Standardized histograms can be automatically converted into Sloth SLO dashboards.
The Real Payoff: This Is What Makes Risky Rollouts Safe
The canonical histogram isn’t the finish line — it’s the prerequisite for doing scary things safely. Migrating a legacy auth backend without this in place is gambling with a UI.
- Shadow deployments — old and new paths both execute, only the old response goes to the user, and a
routing_statelabel on the same histogram tells you exactly how the new path would have performed. For more details, check my previous post on shadow-mode rollout. - Phased rollout gates — shift 1%, then 5%, then 10%, with CI/CD watching the same PromQL error-rate query. New path’s error rate creeps above baseline, pipeline halts and rolls back itself.
Neither works without one comparable, trustworthy signal underneath. You can’t gate a rollout on a metric you don’t trust.
Wrapping Up
More telemetry doesn’t make incidents shorter — trust does. The teams that resolve things fast aren’t the ones with the most dashboards — they’re the ones who picked the right patterns.
This post distills the practice of using counters for what happened, gauges for what state things are in, histograms for how one operation actually behaves, and showcases how efficient we can be with a single histogram metric. That’s the whole model: fewer signals, deliberately chosen, each one you’d stake an incident on without double-checking.
As always, I would love to hear your perspectives — feel free to tag me on Twitter (@typeapi) with your thoughts or stories about your platform outages! Keep your dashboards clean and happy collecting!